
Accelerate Review Part 1: Introduction, Measurements and Culture
This is a summary of the book “ACCELERATE: Building and Scaling High Performing Technology Organizations”.

PREFACE
Starting in 2013 a research journey started trying to do something that was not done before, measure the capabilities and practices that, with a focus on software delivery, separate the high performing companies from those that are not, and, using rigorous methods of analysis that until then were reserved only to academia, help the industry to understand and identify the capabilities that actually drive performance in a statistically meaningful way and obtain results that can be seen in their profitability, productivity and market share and also in those effects that measure noncommercial outcomes like effectiveness, eficiency and customer satisfaction.
This book is divided in 3 parts:
- Part One: What we found
- Part Two: The research
- Part three: Transformation
My articles will only focus on the Part One of the book, which presents the findings of the research, Part Two discusses the science and research behind the results, and Part Three describes some case studies of what is possible when organizations adopt and implement the described capabilities in order to drive performance.
PART ONE: What we found
Chapter 1: ACCELERATE
“Business as usual” is no longer enough to remain competitive. To excel in the market organization must accelerate:
- Delivery of goods and services to delight their customers
- Understand the market to detect and predict customer demand
- Anticipation of compliance and regulatory changes
- Response to risks such as security threats or changes in the economy
At the heart of this acceleration is Software. Software and technology are key differentiators for organizations to deliver value to customers and stakeholders. The strategic use of technology explains revenue and productivity gains more than merges and acquisitions (M&A) and entrepreneurship (2017) (James Bessen - Boston University), Link between technology and profitability (Eric Brynjolfsoon 2008).
Another Forrester report states that DevOps is accelerating technology, but that organizations often overestimate their progress (Klavens et al. 2017). Furhtermore, the report points out that executives are especially prone to overestimating their progress when compared to those who are actually doing the work.
The disconnect between executive and practitioner highlights two considerations; First, estimates of DevOps maturity or capabilities from practitioners are more accurate. Second, it makes clear the need to measure DevOps capabilities accurately and to communicate these measurment results to leaders.
So in order to know where you are, what you need to do to have a clear picture?
FOCUS ON CAPABILITIES, NOT MATURITY
According to the authors maturity models are not the appropiate tool to use or mindset to have. Instead, shifting to a capabilities model of measurement is essential for organizations wanting to accelerate software delivery. This is due to four factors:
- Maturity models focus on helping an organization “arrive” to a mature state and then declare themselves done, whereas technology transformation should follow a continuous improvement paradigm.
- Linear advancement doesn’t allows different parts of the organization to take a customized approach. Teams have their own context, their own constraints, their own goals and what we should focus next depends on those things.
- Capability models are outcome based, on the other hand, maturity models in most cases only measure technical proficiency or tooling. These end up being vanity metrics: while they can be relatively easy to measure, they don’t tell us anything about the impact they have on business.
- The industry is changing: What is good enough and even “high-performing” today is no longer good enough next year. Capability models allow for dynamically changing environments to focus in developing the skills needed to remain competitive.
So, according to the book, maturity models are not the right tool to properly focus on measure how capable we are at helping our business.
EVIDENCE-BASED TRANSFORMATIONS FOCUS ON KEY CAPABILITIES
Which capabilities to focus on? The research in this book has yielded insights in what enables both software delivery performance and organizational performance as seen in profitability, productivity and market share. In fact, the research shows that none of the following often cited factors predicted performance:
- Age and technology used for the application
- Wheter operations teams or development teams performed deployments
- Wheter a change approbal board (CAB) is implemented
This was quite an eye opener !
This research has identified key capabilities. These capabilities are easy to define, measure, and improve. This book aims to get you started in defining and measuring those capabilities.
How do high-performing organizations teams achieve such amazing performance? By improving the right capabilities
Chapter 2: MEASURING PERFORMANCE
In this book the authors wanted to discover what works and what doesn’t in a scientific way. Measuring performance in the domain of software is hard, so the first step to know what are the capabilities that help business must be to define a valid, reliable measure of software delivery performance, and then, the capabilities that allow to reach high outcomes.
FLAWS IN THE PREVIOUS ATTEMPTS TO MEASURE PERFORMANCE
Previous attempts to measure performance were focused on individual or local measures rather than team or global ones and all failed for very obvious reasons: lines of code, velocity, and utilization all resulted in poor measurements of how IT work has any kind of business impact. * find the details in the second chapter of the book *
MEASURING SOFTWARE DELIVERY PERFORMANCE
A succesful measure of performance should focus on a global outcome to ensure teams aren’t pitted against each other (tipical example is developers against operations). Also, the measure should focus on outcome not output: it shouldn’t reward people for putting large amounts of busywork that doesn’t actually help achieve organization goals.
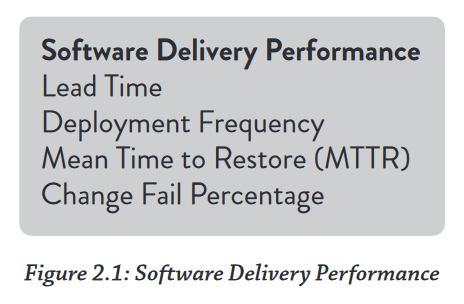
In our search for measures of delivery performance that meet these criteria, we settled on four: delivery lead time, deployment frequency, time to restore service, and change fail rate.
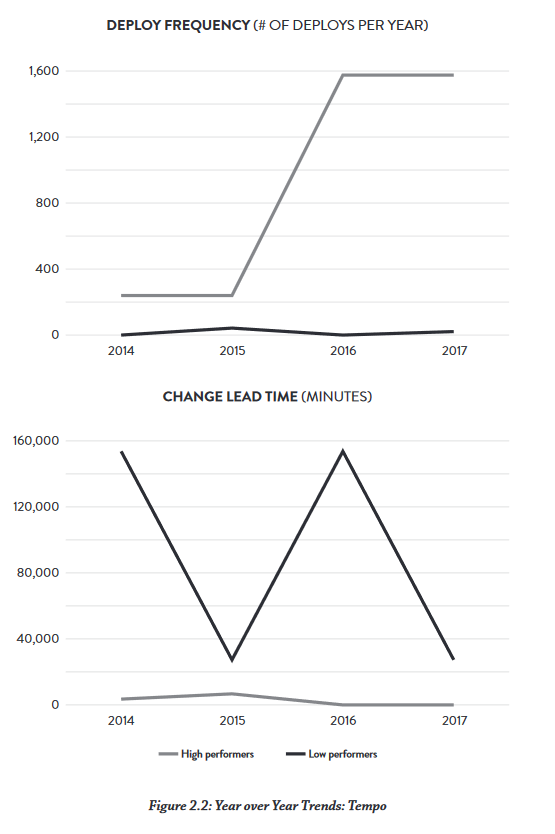
Use lead time as a metric is a key element of Lean theory. Lead time is the time it takes to go from customer making a request to the request being satisfied.
The second metric to consider is batch size. Reducing batch size is another central element of the Lean paradigm. Indeed, it was one of the keys to the success of the Toyota production system. Reducing batch sizes reduces cycle times and variability in flow, accelerates feedback, reduces risk and overhead, improves efficiency, increases motivation and urgency, and reduces costs and schedule growth (Reinertsen 2009, Chapter 9). However, in software, batch size is hard to measure and communicate across contexts as there is no visible inventory. Therefore, the authors settled on deployment frequency as a proxy for batch size since it is easy to measure and typically has low variability.
Delivery lead times and deployment frequency are both measures of software delivery performance “tempo”. However, the authors wanted to investigate if this increase in speed delivery also affects the stability of the systems. Traditionally, reliability is measured as time between failures, but the fact is that in modern software products and services, which are rapidly changing complex systems, failure is inevitable (complex systems tend to unpredictability). So the key question becomes: How quickly can a service be restored?
Finally, a key metric when making changes to systems is what percentage of changes to production fail. In the context of Lean, this is the same as percent complete and accurate for the product delivery process(what is the rate of product production failures), and is a key quality metric.
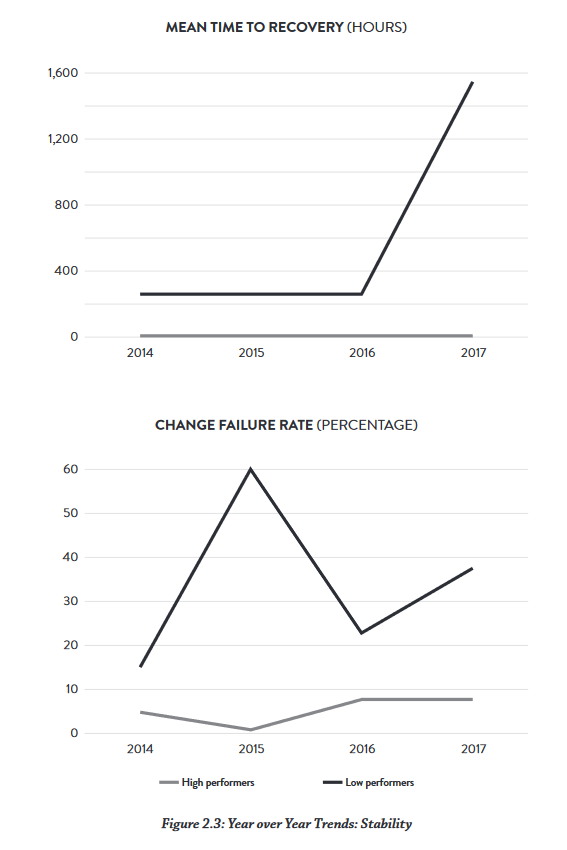
These results demonstrate that there is not tradeoff between improving performance(speed) and achieving higher levels of stability and quality(stability). This is precisely what the Agile and Lean movements predict, but much dogma in the industry still rests on the false assumption that moving faster means trading off against other performance goals (stability, costs, risks…) . This is a key message from the book, you can become faster and more stable at the same time.
The authors have found the right measurements for software delivery performance, after this, the question they try to answer is: Does Software Delivery Performance Matters?
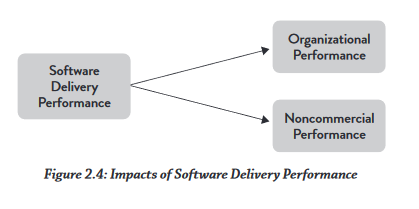
THE IMPACT OF DELIVERY PERFORMANCE ON ORGANIZATIONAL PERFORMANCE
Survey respondents were asked to rate their organization’s relative performance across several dimensions: profitability, market share and productivity.
This measure of organizational performance has also been found to be highly correlated to measures of ROI, and it is robust to economic cycles. Analysis over several years shows that high-performing organizations were consistently twice as likely to exceed these goals as low performers. This demonstrates that your organization’s software delivery capability does in fact provide a competitive advantage to your business.
The authors also found that high-performers were better at non-comercial goals (quantity of goods and services, operating efficiency, customer satisfaction…).
DRIVING CHANGE
Until now the authors have defined software delivery performance in a way that is rigorous and measurable, based on this it should be possible to make evidence-based decisions on how to improve the performance, also now teams can be compared against other teams or other organizations, their improvement can be measured and probably most exciting of all, authors are able in their studies to go beyond correlation and start testing predictions and hypotheses.
Now we can use tools like the table 2.8 to know where we are, but it is essential to use such tools carefully. In organizations with a learning culture, they are powerful. But “in pathological and bureaucratic organizational cultures, measurement is used as a form of control, and people hide information that challenges existing rules, strategies, and power structures”. ‘Whenever there is fear, you get the wrong numbers’.
Before an organization is ready to use a scientific approach to improve performance, we must first understand and develop the right culture. This is the topic the authors turns to then:
Chapter 3: MEASURING AND CHANGING CULTURE
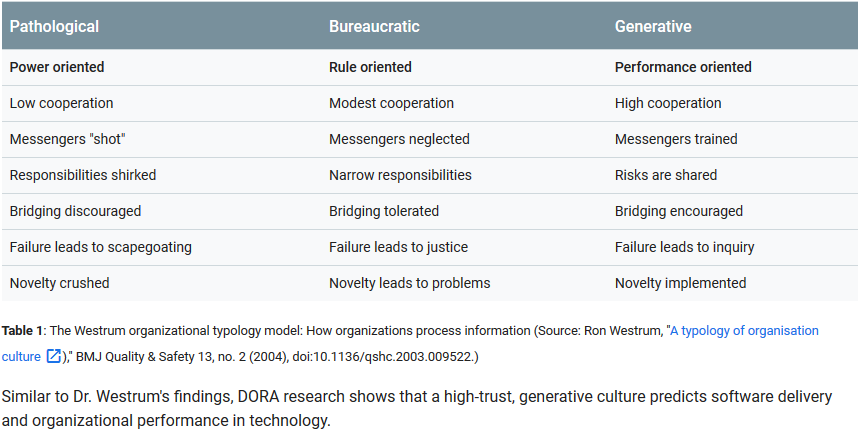
In this chapter the authors explain how organization culture can be divided in 3 levels: assumptions, values and artifacts (Schein 1985). And how they focus on the second level, values, to drive their measurements and the actions for change. The model they use to measure organization culture is the Westrum Model (Ron Westrum 1988). Westrum has been researching human factors in system safety, particularly in the context of accidents in domains that were highly complex and risky, such as aviation and healthcare. He developed the following typology of organizational cultures:
- Pathological (power oriented) Characterized by large amounts of fear and threat. People often hoard information or withhold it for political reasons, or distort it to make themselves look better.
- Bureaucratic (rule-oriented) This organizations protect departments. Departments want to maintain their walls, insist on their own rules, and generally do things by the book- their book.
- Generative (performance-oriented) Focus on the mission. Everything is subordinated to good performance, to doing what we are supposed to do.
This model predicts information flows, and there is also a clasification of good information flows:
- It provides the answers that are needed
- It is timely
- Is presented in a way that can be effectively used
According to the authors, this model not only predicts information flow, it is also directly linked with performance and safety outcomes.
MEASURING CULTURE
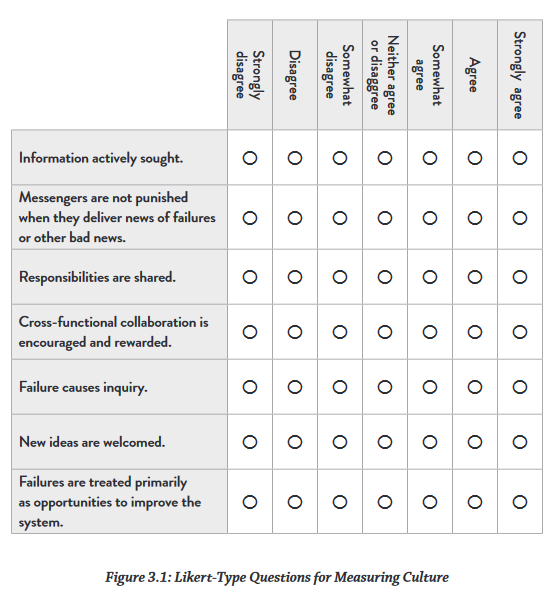
In this section there are a few concepts about statistics, polls and the scientific method that conclude that the best possible way is to ask Likert-type questions, from “Strongly Disagree” to “Strongly Agree” in numbers that allow for statistically useful conclusions. The questions they used are the following:
In 2016, 31% of respondents were classified as pathological, 48% as bureaucratic and 21% as generative. The authors believe their research has consistently found a construct that is both valid and reliable.
The authors also make the comment that bureaucratic cultures are not necessarily bad, since rules are put in place to ensure fairness of treatment in every case. The problems arise when following rules becomes more important than achieve goals.
WHAT DOES WESTRUM ORGANIZATIONAL CULTURE PREDICT?
- Good culture (generative) requires trust and cooperation between people across the organization, so it reflects the level of collaboration and trust inside the organization
- If in a team there is better information available and decisions are easier to be corrected because it is not closed and hierarchical, authors assume that it can predict better decision making
- Problems are more rapidly discovered and addressed, so this teams do a better job with people
CONSEQUENCES OF WESTRUM’S THEORY FOR TECHNOLOGY ORGANIZATIONS
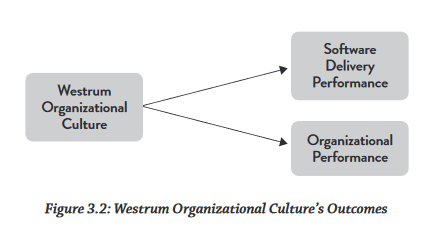
The westrum model was initially developed to predict safety outcomes, the research from the authors shows it also predicts both softwade delivery and organizational performance. This makes sense from different points of view, on one side safety outcomes are performance outcomes in a healthcare setting, and on the other side, only safe environments allow for change to happen fast and safely since those are context which can handle change with a low level of risk, which means, culture is also a predictor for innovation, only on those organizations where is safe to realize and try changes innovation will happen. This conclusion is aligned by some research done by Google in the this field.
Google wanted to discover if there were any common factors among its best-performing and most innovative teams. Then started a two-year research project to investigate what made Google teams effective, conducting hundreds of interviews on hundreds of teams. They expected to find a combination of individual traits and skills that would be key ingredients for high-performing teams. What they found instead was that “who is on a team matters less than how the team members interact, structure their work, and view their contributions” (Google 2015). In other words, it all comes down to team dynamics.
HOW DO WE CHANGE CULTURE?
John Shook, describing his experiences transforming the culture of the teams at the car manufacturing plant that was the genesis of the Lean manufacturing movement in the US wrote “what my . . . experience taught me that was so powerful was that the way to change culture is not to first change how people think, but instead to start by changing how people behave–what they do” (Shook 2010)"
The authors hypothesize that, following the theory developed by the Lean and Agile movements, implementing the practices of these movements can have an effect on culture. Then they set out to look at both technical and management practices, and to measure their impact on culture. Their research concludes that Lean Management, along with a set of other technical practices known collectively as Continuous Delivery (Humble and Farley 2010), do in fact impact culture.
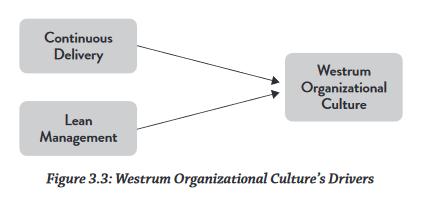
Authors conclude that every organization can act their way towards a better culture by implementing those practices. In the next chapters the authors will go first towards the technical practices that make a difference to improve the culture, and then the management practices.
RESUME
The authors start by trying to find out measures that can be used to quantify software delivery performance, then, investigate if there is a relation between this measurements and the business performance of the organization, which they found (high performers are twice as likely to perform better in the market). In order to quantify your performance, you need a culture that allows for the necessary openness, and not surprisngly this kind of culture can also be directly related with high performers. So, it makes sense that the first thing to do is to try to change the culture of the organization. But in order to do this, the most effective method is not to change people’s mindsets, but to redefine people’s work. The author’s will explore in the next chapters Lean Management and Continuous Delivery as those practices that help redefine people’s work, organization culture and finally the software delivery practices that helps businesses to succeed and will do so backed up with their research on impact.
I will resume those chapters in the PART 2 of this article.
